Highlights
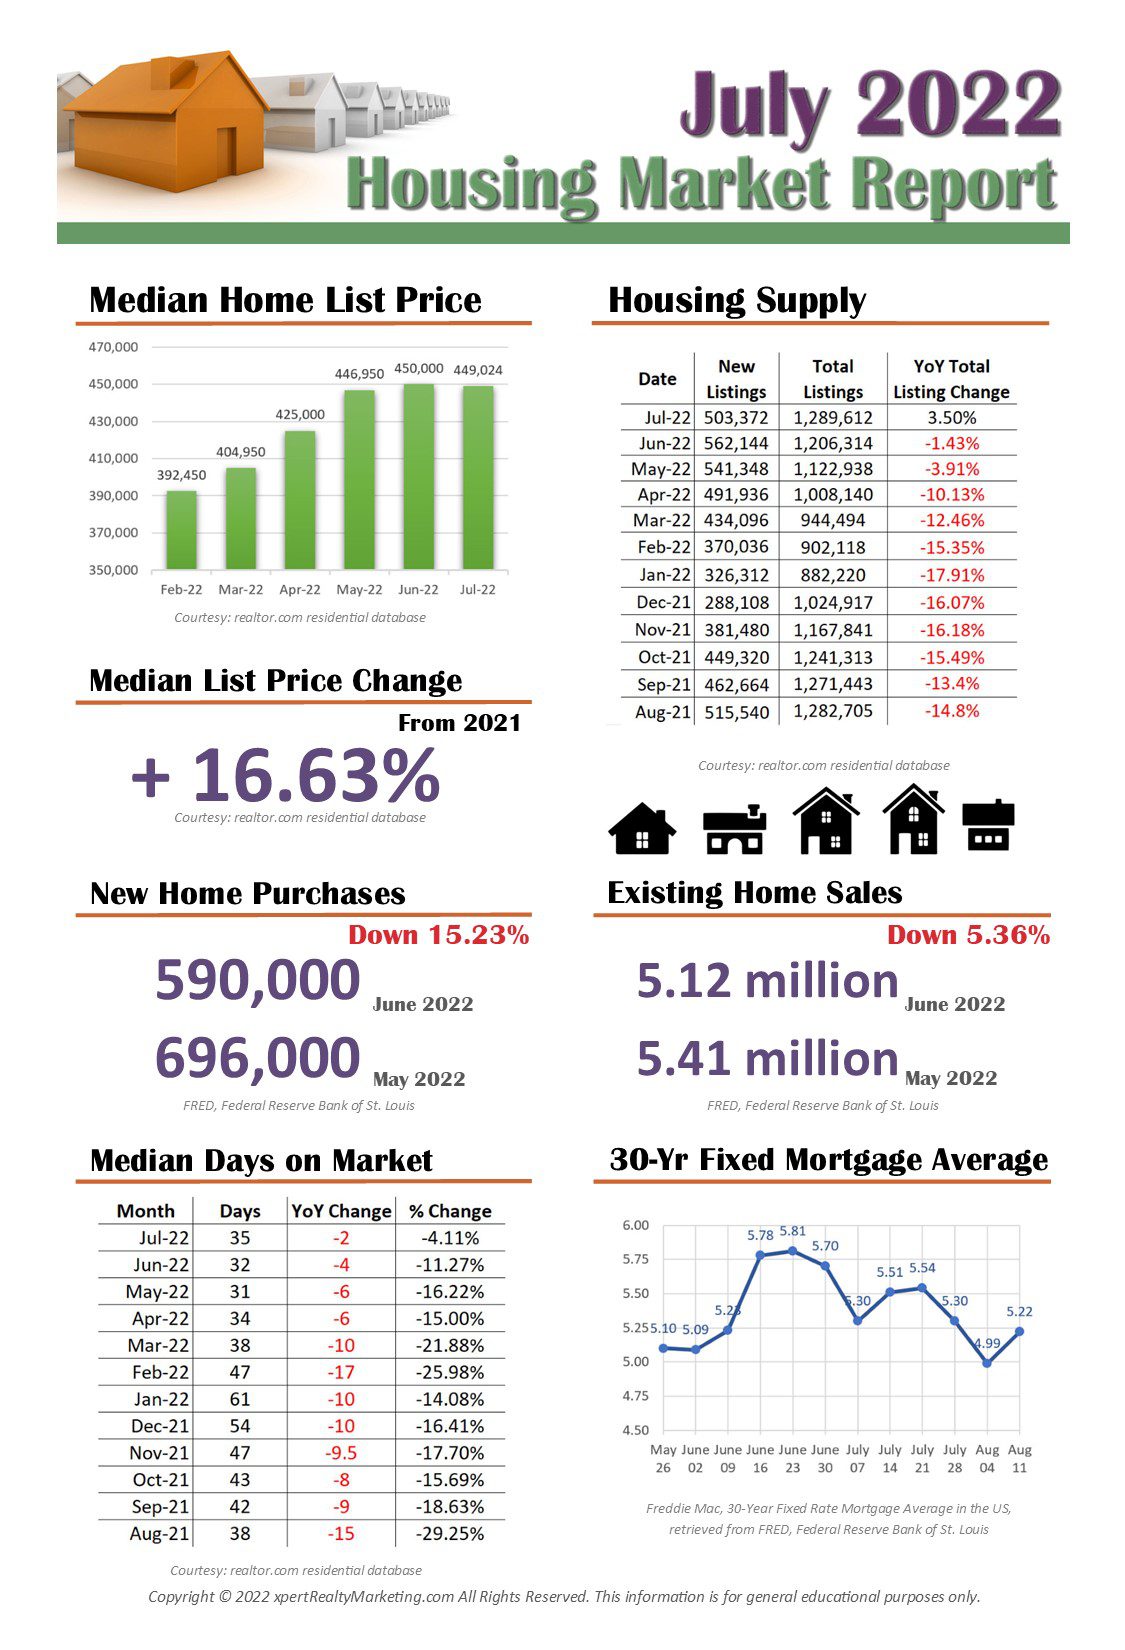
- Nationally, the inventory of homes actively for sale on a typical day in July increased by 30.7% over July 2021, the largest inventory increase in Realtor.com® data history. Higher than June’s record-breaking growth rate of 18.7%.
- The total inventory of unsold homes, including pending listings, increased by just 3.5% year-over-year due to a decline in pending inventory, but this is the first increase since September 2019.
- The median list price grew by 16.6% in July, supported by slowly adjusting seller expectations and a bigger share of larger homes listed. However, signs of softening price growth are present in a decelerating growth rate and a rising share of price reductions.
- Newly listed homes declined by 2.8% in July compared to July 2021, breaking a three-month streak of positive annual listing growth since April.
- Time on the market was 35 days in July, just two days less than July 2021 of last year, but 26 days less than typical pre-pandemic levels.
© 2022 xpertRealtyMarketing. Sign up to have real estate articles delivered to your website.

